23 Research Data Things – 23. The end! Now what?

bartcelebrating.gif

Woohoo, I made it!

I had a lot of fun going through the program, and learned a lot about research data that I can apply to my work and share with my colleagues.

My favourites were anything to do with metadata.  I also had a good opportunity for reflection and discussion being part of the catch-up webinar in June. I’ve already reflected in my blog on this.

I also used pages on the ANDS website, and other resources linked to in the “things”, throughout my uni subject this semester on research data management. So the program has been immediately helpful for that. I’m also going to plug the program to my colleagues.

I’ll be keeping an eye out for more opportunities to do fun data stuff, especially getting into some of the technical skills that I didn’t do the first time around.

Peace out.

1010101010101010101
23 Research Data Things – 22. Big Data

To most people the term “big data” is associated with the data that corporations collect about us through our facebook posts, the GPS on our smartphones, and what products we scan at the checkout. It’s not just Big Data, it’s Big Brother. That is one very pervasive example of it, but “big data” basically refers to all the huge volumes of data that are generated every day, that we currently don’t have the capacity to fully use. I found this video quite helpful and accessible for explaining these ideas:

The mind boggles at how much data is collected using high-tech telescopes and satellites. I looked at the Australian Square Kilometre Array Pathfinder (ASKAP) telescope – which produces 2.5 gigabytes of data per second, or 75 petabytes per year. I was impressed at the collaboration between different organisations to store, analyse, manage and publish the data. Without that high level of collaboration, it wouldn’t be possible.

23 Research Data Things – 21. Dirty Data

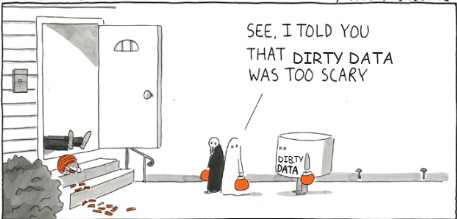
dirty-data-comic
Source

There’s a great story about an influential economics paper Growth in a Time of Debt by Reinhart & Rogoff, where the dataset had a simple calculation error that was busted by a student when he tried to replicate the study for an assignment. Here’s an article about it that makes for good reading:  http://www.bbc.com/news/magazine-22223190. My economist brother told me about it a while ago, and it instantly sprung to mind.

This incident also appears in European Spreadsheet Risks Interest Group’s list of horror stories (it’s the second entry) http://www.eusprig.org/horror-stories.htm. The Excel formula used for the calculation that was key to the researcher’s argument was AVERAGE(L30:L44) when it should have been AVERAGE(L30:L49) – leaving off 5 rows of data and schewing the results. Oops!

But it’s so easy to make that kind of mistake! The cynic in me wonders if resistance to open data is at least partially influenced by researchers being worried they’ll have made a similar type of mistake somewhere and have it found out. If it can happen to a couple of Harvard professors, it can happen to anyone!

I liked learning about Open Refine, and was impressed at its capability for cleaning up inconsistent cells. You can use Excel’s Filter options to clean up consistences, typos, or duplicates (or if you’re entering data into a spreadsheet, you can use the data validation tool to control what values can be put in each cell to prevent it becoming messy), but the process is more manual and Open Refine’s functions make it a lot easier.

23 Research Data Things – 20. Find it with data!

I think what makes geospatial visualisations powerful is that they are able to overlay different information which lets you see a connection. e.g. in the PetaJakarta project they overlay a map of different neighbourhoods, river networks, geotags from Twitter, colour-coded areas of high activity, etc. This means that they are bringing different data together to form the big picture and identify situations where these factors cross – it’s a quick and effective way to see needs and respond to them.

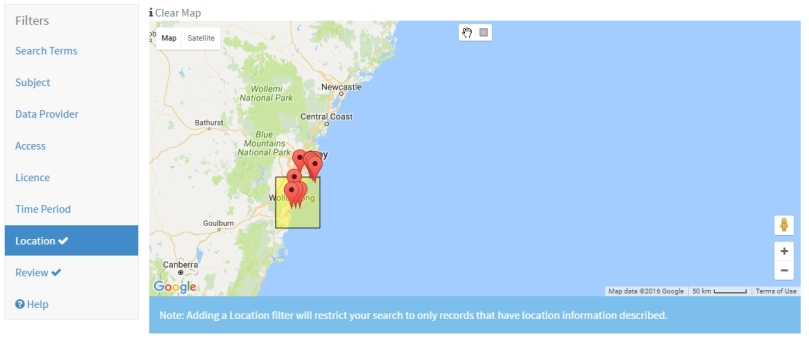
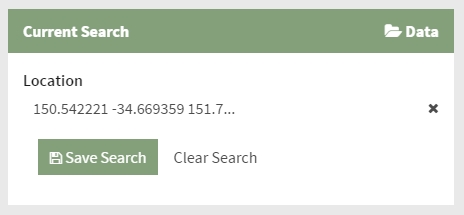
If 80% of all research data has a geographic or spatial component, it’s important to be able to search datasets by geography! I love the spatial search interface and being able to draw a box over a physical area on the map. And once you run the search, you can see that it translates to a range of co-ordinates. Cool stuff! I think this could definitely lead to new research questions – it is an obvious way to identify ‘gaps’ in a subject area where a physical location hasn’t been studied yet. Screenshot of spatial search

location search


23 Research Data Things – 19. Data APIs and Apps

APIs

I was impressed with Trove Application Gallery. I think it’s neat that Trove put their API out there for free, there are some pretty cool projects that people have made. It makes data more ‘fun’ and usable for different audiences.

Apps

I really enjoyed reading the 8 apps that turn citizens into scientists article. I think the idea of the citizen scientist is great, and it’s a great way to leverage the pervasive technology of smart phones to collect a large amount of data.